

Research & Data
U.S. employers added 165,000 jobs in October, well above the average gain of 48,000 a month over the prior 12 months, according to the Bureau of Labor Statistics’ the Employment Situation report released Friday, Nov. 6. The unemployment rate was 4.1%, down from 4.2% in September, a move the bureau described as little changed.
The report also raised its estimates for the two previous months. August payroll growth was revised up by 53,000, to 186,000, and September was revised up by 31,000, to 60,000. Combined, employment in those two months was 84,000 higher than previously reported. BLS said monthly revisions reflect additional reports from businesses and government agencies received since the last estimates, along with recalculated seasonal factors. The October figure itself is preliminary and will be revised in the next two reports.
Where the jobs came from
Three industries accounted for most of October’s gain. Professional and business services added 70,000 jobs, far above its prior 12-month average of 15,000 a month. Within that sector, professional, scientific and technical services added 33,000, administrative and support and waste management services added 28,000, and management of companies added 9,000.
Health care added 42,000 jobs, compared with an average monthly gain of 31,000 over the prior year. Hospitals added 16,000, home health care 11,000 and outpatient care centers 5,000.
Transportation and warehousing added 25,000, led by couriers and messengers at 17,000 and air transportation at 4,000. Manufacturing added 19,000, including 7,000 in computer and electronic products, 4,000 in machinery and 4,000 in primary metals.
Employment showed little change in mining and oil and gas extraction, construction, wholesale trade, retail trade, information, financial activities, social assistance, leisure and hospitality, other services and government. Government employment rose by 6,000 in October after a decline of 18,000 in September.
Pay and hours
Average hourly earnings for all private-sector employees rose 14 cents, or 0.4%, to $38.00. Over the past 12 months, hourly pay was up 3.1%. For production and nonsupervisory employees, hourly earnings rose 12 cents, or 0.4%, to $32.75.
The average private-sector workweek was unchanged at 34.4 hours. In manufacturing, the workweek held at 40.5 hours and overtime rose 0.1 hour to 3.1 hours. The workweek for production and nonsupervisory employees slipped 0.1 hour to 33.8 hours.
A softer signal in the household survey
Not every measure pointed the same way. The number of people working part time for economic reasons rose by 339,000 to 4.8 million. BLS defines these workers as people who would have preferred full-time jobs but were working part time because their hours had been cut or they could not find full-time work. The broadest official measure of labor underutilization, known as U-6, which counts those workers along with the unemployed and people marginally attached to the labor force, was 7.9% in October, up from 7.6% in September.
The number of unemployed people was 7.1 million. The long-term unemployed, those jobless for 27 weeks or more, numbered 2.0 million and made up 27.6% of all unemployed people. The labor force participation rate edged up to 61.9% from 61.8%, and the employment-population ratio rose to 59.3% from 59.2%.
Among major worker groups, unemployment rates showed little or no change. The rate was 3.9% for adult men, 3.6% for adult women, 13.9% for teenagers, 3.7% for White workers, 6.6% for Black workers, 2.8% for Asian workers and 4.7% for Hispanic workers.
Outside the labor force, 6.0 million people said they currently wanted a job. Of those, 1.6 million were marginally attached to the labor force, meaning they had looked for work in the prior 12 months but not in the four weeks before the survey, including 448,000 discouraged workers who believed no jobs were available to them.
What it means for job seekers
The payroll gains were concentrated in white-collar business services, health care and delivery work, so openings in those fields are where the hiring in October showed up. The rise in involuntary part-time work is a reminder that a stronger headline does not mean every worker who wants more hours is getting them.
The household survey’s year-over-year comparisons carry a caveat: household data for October 2025 were not collected because of that year’s federal government shutdown. BLS has scheduled the November jobs report for Friday, Dec. 4.
Sources
- U.S. Bureau of Labor Statistics, “The Employment Situation — October 2026” (USDL-26-1632), November 6, 2026. https://www.bls.gov/news.release/archives/empsit_11062026.htm
- U.S. Bureau of Labor Statistics, “Employment Situation Summary,” November 6, 2026. https://www.bls.gov/news.release/empsit.nr0.htm
- U.S. Bureau of Labor Statistics, “Employment Situation Summary Table A. Household data, seasonally adjusted,” November 6, 2026. https://www.bls.gov/news.release/empsit.a.htm
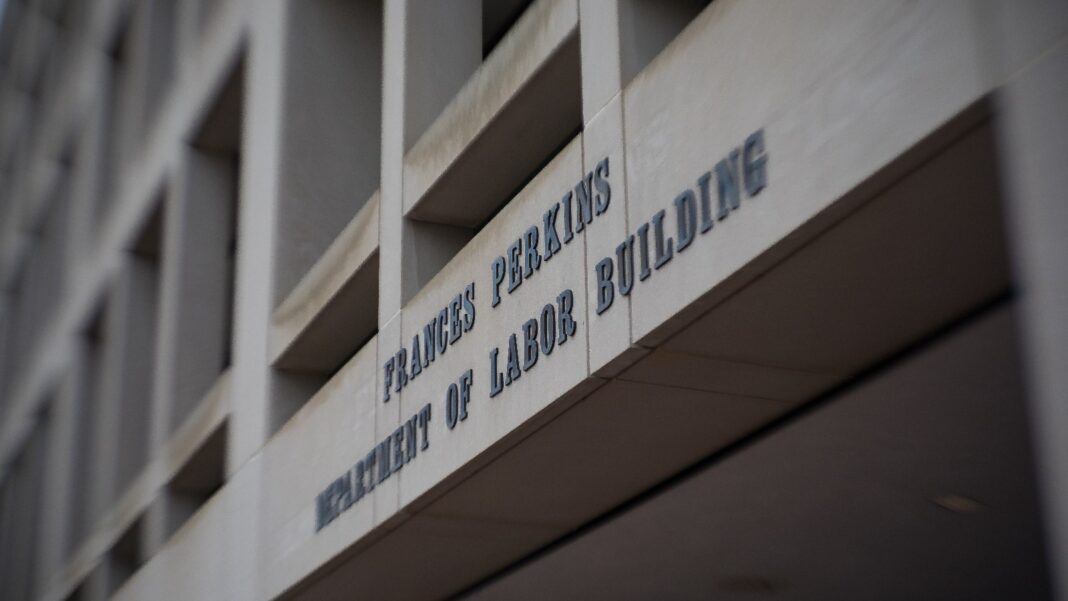
Featured photo: The inscription over an entrance to the Frances Perkins Building, headquarters of the U.S. Department of Labor, in Washington, D.C., photographed Nov. 14, 2017. Representative image; the Bureau of Labor Statistics is part of the Labor Department but is not housed in this building. Photo: US Department of Labor (Shawn T. Moore), via Wikimedia Commons (CC BY 2.0). Cropped from the original.