


Labor Market
U.S. manufacturing output rose 0.3% in September, the Federal Reserve reported Friday, Oct. 16, recovering from a revised 0.2% decline in August. Total industrial production, which also includes mining and utilities, increased 0.7%, with much of the extra lift coming from a 3.5% jump in utility output.
For the third quarter as a whole, factory output grew at an annual rate of just 0.7%, well behind the 2.8% annual-rate gain for total industrial production. Over the past year, manufacturing output is up 1.1% and total industrial production 2.2%.
Inside the factory numbers
The September gain was uneven. Durable goods manufacturing edged up 0.1%, held back by a 3.0% drop in motor vehicles and parts. Several other durable industries were stronger: primary metals, machinery, and electrical equipment, appliances and components each rose 1% or more. Nondurable manufacturing rose 0.4%, led by printing and support activities and chemicals.
The quarterly picture shows a sharp split between the two halves of manufacturing. Durable goods output grew at a 3.8% annual rate in the third quarter, driven in part by a 28.4% gain in semiconductors and related electronic components, while nondurable output fell at a 1.6% rate.
Outside manufacturing, mining output rose 0.2% in September and expanded at a 5.0% annual rate in the quarter. Utility output, which rose on gains for both electric and natural gas utilities, grew at a 14.8% annual rate in the third quarter and is 8.7% above its year-earlier level. The Fed’s release did not attribute the utility increase to a specific cause.
The total industrial production index stood at 104.0 in September, where 2017 equals 100. The Fed also revised earlier months up: August’s total change now reads a 0.1% gain rather than unchanged, and the index levels for May through August were each raised by 0.1 to 0.2 point.
Capacity use is still below normal
Capacity utilization for total industry rose to 76.9% in September from a revised 76.4% in August. That remains 2.5 percentage points below its 1972 to 2025 average of 79.4%. For manufacturing alone, utilization rose 0.1 point to 75.9%, 2.3 points below its long-run average of 78.2%. Mining was the exception, operating at 87.5% of capacity, above its long-run average of 85.2%. Utilities ran at 73.8%, compared with a long-run average of 84.0%.
By market group, every major category rose in September except business equipment, which was unchanged for the month but is up 6.7% from a year earlier. Consumer goods output rose 0.7% and construction supplies 1.0%.
What it means for factory jobs
Output and employment are different measures. Plants can raise production by running existing lines longer, adding overtime, automating or changing their product mix without adding workers at the same pace. With manufacturing capacity use more than 2 points below its historical norm, many factories have room to increase output before they need to expand their workforces or facilities.
The month’s details point in different directions for workers. Gains in machinery, metals and electrical equipment, along with strong third-quarter semiconductor output, suggest pockets of demand for skilled production, maintenance and technical staff. The drop in motor vehicle and parts production points the other way for auto-sector workers. Neither trend is confirmed by this report, which measures output rather than hiring.
Caveats
September figures are preliminary and often revised, as the upward changes to earlier months in this release show. The Fed plans an annual revision to industrial production and capacity data on Nov. 24, 2026, which may change the historical picture as well.
Sources
- Board of Governors of the Federal Reserve System, “Industrial Production and Capacity Utilization – G.17,” October 16, 2026. https://www.federalreserve.gov/releases/g17/current/default.htm
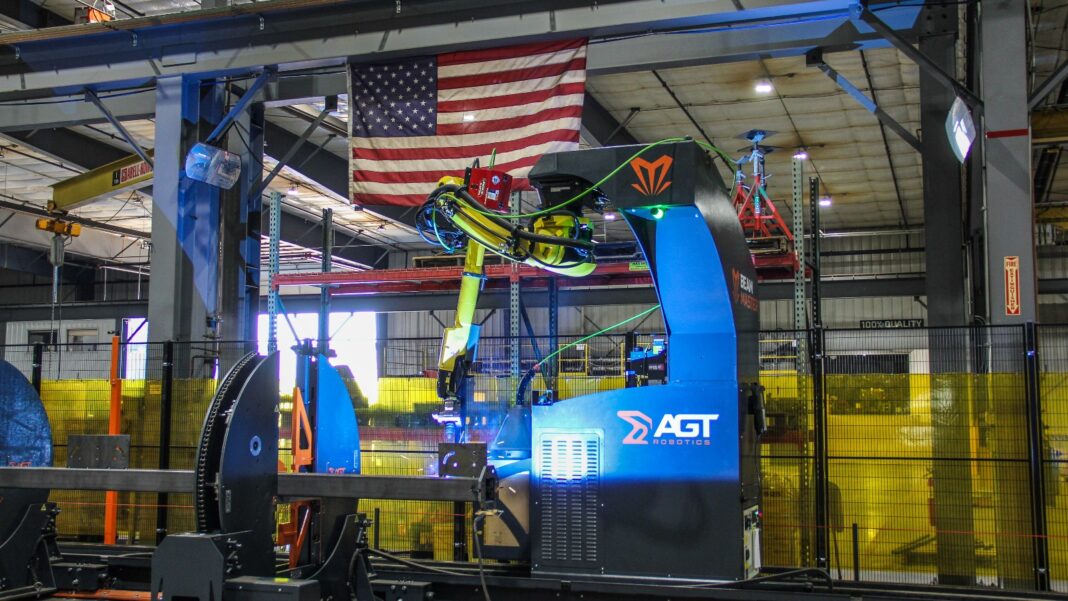
Featured photo: A robotic welding machine on the fabrication floor of Mid-States Material Handling & Fabrication in Nevada, Iowa, Oct. 9, 2026. Representative image; not a depiction of the Federal Reserve's September industrial production data. Photo: Cecilia Lynch, USDA, via Wikimedia Commons (Public domain). Cropped from the original.





.jpg)