


Research & Data
Prices for goods the United States buys from abroad rose 1.1% in September, the Bureau of Labor Statistics reported Friday, Oct. 16. That followed a revised 0.5% increase in August and pushed import prices 8.1% above their level of September 2025, the largest 12-month advance since the index rose 8.8% in the year ended July 2022.
The increase was not only about oil. Fuel import prices jumped 4.8% for the month, but prices for nonfuel imports also climbed 0.7%, and the agency said nonfuel import prices have not declined on a monthly basis since August 2025. Over the past year, nonfuel import prices are up 6.0%, the largest such gain since the 12 months ended April 2022.
Where the increases showed up
Within fuel, import prices for petroleum and petroleum products rose 4.6% in September and natural gas prices rose 1.6%. Over 12 months, fuel import prices are up 34.5%, petroleum 35.4% and natural gas 96.5%, the biggest annual rise for natural gas since the year ended June 2022.
Among nonfuel categories, the BLS said higher prices for capital goods, nonfuel industrial supplies and materials, consumer goods excluding automobiles, and automotive vehicles, parts and engines drove the September increase. Capital goods import prices rose 0.9% for the month and 8.4% from a year earlier, a figure that bears directly on companies buying machinery, computers and other equipment from overseas. Nonfuel industrial supplies and materials rose 1.4%, after a 1.3% gain in August.
Consumer goods excluding automobiles rose 0.4% in September and 2.7% over the year. Automotive vehicles, parts and engines rose 0.3% for the month and 1.1% over the year. Import prices for foods, feeds and beverages were unchanged in September and up 2.9% from a year earlier.
By trading partner, import prices from China rose 0.7% in September, the largest monthly advance since December 2021, and were 3.1% higher than a year earlier. Prices of imports from Canada rose 1.3%, from Mexico 0.6%, from Japan 0.6% and from the European Union 0.3%.
Export prices rose faster
Export prices rose 2.2% in September after a 1.2% increase in August and were 11.6% higher than a year earlier, the largest over-the-year rise since the 12 months from July 2021 to July 2022. Agricultural export prices rose 2.6%, the biggest monthly gain since November 2022, led by soybeans, corn and wheat. Nonagricultural export prices rose 2.1% for the month and 11.8% over the year.
The BLS also revised earlier months. August’s import increase now stands at 0.5%, and July’s figure was revised to a 0.4% decline, with fuel import prices down 6.8% that month.
What it means for employers and workers
Import price indexes measure what buyers pay for foreign goods; they do not count jobs or wages. Still, broad increases in the cost of imported equipment, materials and consumer goods raise input costs for many employers, from manufacturers buying parts to retailers stocking shelves. When costs rise, businesses either absorb them in margins, pass them on in prices, or look for savings elsewhere, which can include slower hiring or smaller raises. How much of that happens depends on the industry and on how long the increases last.
The September data alone do not show any change in hiring. They establish that cost pressure from imports was wide-ranging last month, not limited to energy.
What comes next
The BLS is scheduled to publish October import and export price data on Tuesday, Nov. 17, 2026, at 8:30 a.m. Eastern. Monthly figures are subject to revision as more price reports come in, as the July and August changes in this release show.
Sources
- U.S. Bureau of Labor Statistics, “U.S. Import and Export Price Indexes News Release – 2026 M09 Results,” October 16, 2026. https://www.bls.gov/news.release/ximpim.htm
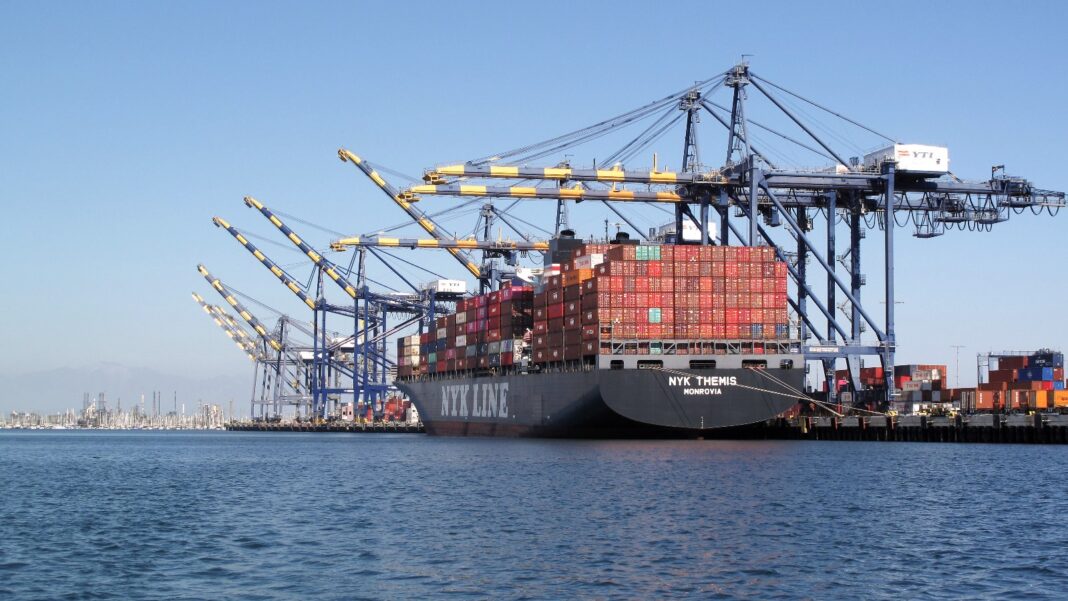
Featured photo: The container ship NYK Themis docked under cargo cranes at the Port of Los Angeles, Sept. 18, 2021. Representative image; not a depiction of the September 2026 import price data. Photo: Downtowngal, via Wikimedia Commons (CC BY-SA 4.0). Cropped from the original.