


Research & Data
Prices that U.S. producers receive for their goods and services rose 1.3% in September, the Bureau of Labor Statistics reported on Oct. 15. That was the largest monthly increase in the Producer Price Index for final demand since March 2022, when it rose 1.7%, and it followed gains of 0.5% in August and 0.2% in July.
Over the 12 months through September, the final-demand index rose 6.3% before seasonal adjustment. BLS said that was the biggest annual increase since December 2022.
Energy did most of the work
The surge was concentrated in goods. Prices for final-demand goods climbed 2.6% in September, the largest monthly increase since BLS began publishing the series in December 2009. The agency said more than 80% of that rise came from energy, where prices jumped 10.8% in the month. Gasoline alone rose 20.3%, and BLS said diesel fuel, residential electric power and crude petroleum also increased.
On a 12-month basis, final-demand energy prices were up 35.4% and final-demand goods 9.8%. Food was a different story: final-demand food prices rose 1.2% in September but were unchanged from a year earlier.
Final-demand services rose 0.8% in September, the largest increase since April. Trade margins, which measure what wholesalers and retailers receive for distributing goods, rose 1.4%. Transportation and warehousing services rose 3.4% for the month and 16.0% over the year, with truck freight among the categories that rose.
A narrower measure that strips out food, energy and trade services rose 0.5% in September, up from 0.3% in August, and was 5.0% higher than a year earlier. That gauge suggests the price pressure is not limited to fuel, though energy accounts for most of the September jump.
Costs are building earlier in the pipeline
Earlier stages of production showed even steeper increases. Prices for processed goods bought as business inputs rose 2.5% in September and 14.1% from a year earlier, while unprocessed goods were up 8.4% in the month and 21.5% over the year. Higher input costs at those stages can take months to reach finished goods and consumer prices, if they pass through at all.
Why it matters for workers and employers
The PPI measures prices received by domestic producers, not what households pay, and it says nothing directly about hiring or pay. But it lands one day after two other BLS releases that show how the same price pressures are reaching workers.
The Consumer Price Index, released Oct. 14, rose 3.7% over the 12 months through September. In the companion real-earnings report the same day, BLS said inflation-adjusted average hourly earnings for all employees fell 0.5% from August to September and 0.7% from a year earlier. In other words, prices are rising faster than paychecks, and the September producer data show businesses facing sharply higher costs at the same time.
For employers in fuel-intensive or distribution-heavy industries, the September report points to higher operating costs. Whether those costs show up in prices, margins or hiring decisions is not something the PPI can answer, and the release itself makes no such claim.
The catch
September figures are preliminary. BLS revises producer price indexes for up to four months after first publication to reflect late reports and corrections, and it revised data for May through August in this release. Most of the September increase traced to energy, which can reverse quickly. The October PPI is scheduled for release on Nov. 13 at 8:30 a.m. Eastern.
Sources
- U.S. Bureau of Labor Statistics, “Producer Price Indexes – September 2026,” October 15, 2026. https://www.bls.gov/news.release/archives/ppi_10152026.htm
- U.S. Bureau of Labor Statistics, “Consumer Price Index – September 2026,” October 14, 2026. https://www.bls.gov/news.release/archives/cpi_10142026.htm
- U.S. Bureau of Labor Statistics, “Real Earnings – September 2026,” October 14, 2026. https://www.bls.gov/news.release/archives/realer_10142026.htm
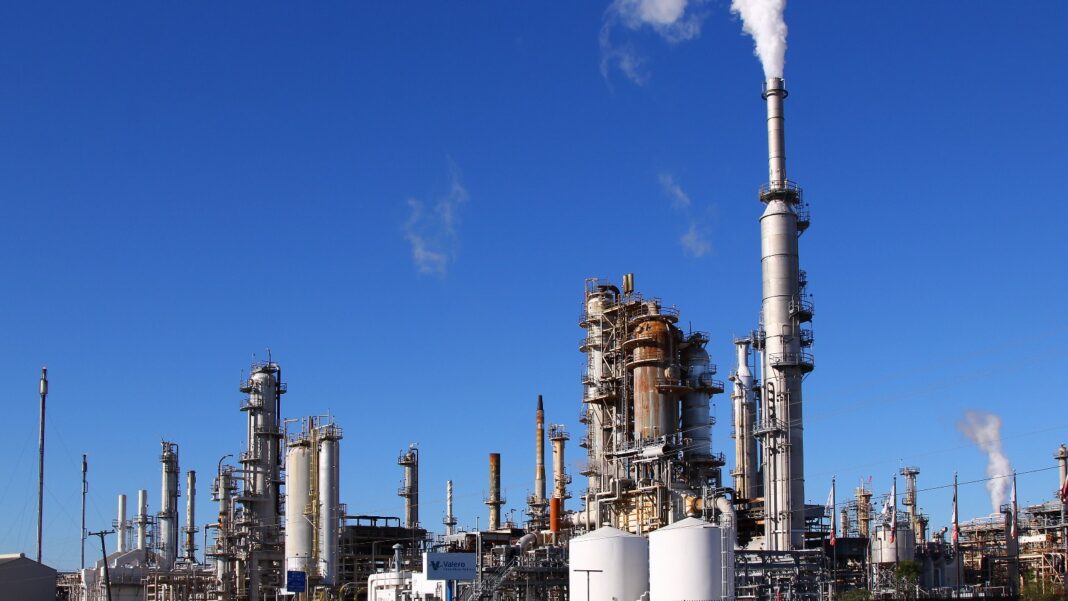
Featured photo: The Valero refinery in Three Rivers, Texas, photographed Oct. 30, 2020. Representative image; not a facility named in the BLS report. Photo: Larry D. Moore, via Wikimedia Commons (CC BY 4.0). Cropped from the original.