


Labor Market
The average U.S. retail price of on-highway diesel was $6.179 a gallon in the week of Oct. 12, according to the U.S. Energy Information Administration, about $2.51 more than a year earlier. Federal producer-price data released Oct. 15 show that cost now moving into what shippers pay to move goods by truck.
EIA’s weekly survey, released Oct. 14, put diesel at $3.665 in the comparable week of 2025, so the national average is up roughly 69% in a year. The run-up has been uneven. Diesel averaged $3.477 in the first week of January 2026, jumped from $3.897 to $4.859 in a single week in early March, eased to about $4.58 in early July, then climbed again to a 2026 peak of $6.529 in the week of Sept. 21.
Prices have since edged down for three straight weeks, but only by about 35 cents. California remains the most expensive market at $8.091 a gallon, while the Lower Atlantic region, which includes Georgia, averaged $5.645, still about $2 above its year-earlier level.
Freight rates are moving
The Bureau of Labor Statistics’ Producer Price Index for September showed No. 2 diesel fuel prices at the producer level up 21.0% from August and 115.2% from a year earlier. The index for truck transportation of freight, which tracks what trucking companies charge, rose 3.8% in September and 19.3% over 12 months.
That is a much steeper increase than for other freight modes in the same report. Rail freight was up 1.3% from a year earlier and air freight 6.4%, while water freight matched trucking at 19.3%. Warehousing and storage prices rose 2.5%. Across the economy, BLS said final-demand transportation and warehousing services rose 16.0% from a year earlier.
Food costs have not followed, yet
The pass-through to grocery shelves is less clear. In the PPI, final-demand food prices were unchanged from a year earlier, and processed foods and feeds bought by businesses were down 1.9%. Some farm commodities rose sharply over the year, including wheat at 49.8%, corn at 30.0% and oilseeds at 27.8%, but meat, poultry and dairy prices fell.
The Consumer Price Index released Oct. 14 showed food-at-home prices up 1.8% over the 12 months through September, and down 0.1% from August, well below the 3.7% increase in overall consumer prices. Higher freight costs can reach retail prices with a delay as shipping contracts renew, but the September data do not yet show it in food.
What it means for trucking jobs
Despite the fuel shock, trucking employment has held steady so far. BLS payroll data show truck transportation employed 1,473,100 people in September, seasonally adjusted, compared with 1,472,300 in September 2025. The September and August figures are preliminary.
For drivers and logistics workers, the numbers point to an industry absorbing far higher fuel bills while charging customers more, not one shedding jobs. The federal figures do not break out costs or employment for small carriers and owner-operators, so how evenly that burden is shared is not yet visible.
The catch
The PPI and payroll figures for September are preliminary and subject to revision. The truck-freight index measures prices, not volumes or profits, so it does not show whether demand for shipping is rising or falling. EIA’s next weekly diesel update is scheduled for Oct. 20.
Sources
- U.S. Energy Information Administration, “Gasoline and Diesel Fuel Update,” October 14, 2026. https://www.eia.gov/petroleum/gasdiesel/
- U.S. Energy Information Administration, “U.S. No 2 Diesel Retail Prices (Dollars per Gallon),” weekly series, accessed October 15, 2026. https://www.eia.gov/dnav/pet/hist/LeafHandler.ashx?n=PET&s=EMD_EPD2D_PTE_NUS_DPG&f=W
- U.S. Bureau of Labor Statistics, “Producer Price Indexes – September 2026,” October 15, 2026. https://www.bls.gov/news.release/archives/ppi_10152026.htm
- U.S. Bureau of Labor Statistics, “Consumer Price Index – September 2026,” October 14, 2026. https://www.bls.gov/news.release/archives/cpi_10142026.htm
- U.S. Bureau of Labor Statistics, “All employees, thousands, truck transportation, seasonally adjusted,” Current Employment Statistics, accessed October 15, 2026. https://data.bls.gov/timeseries/CES4348400001
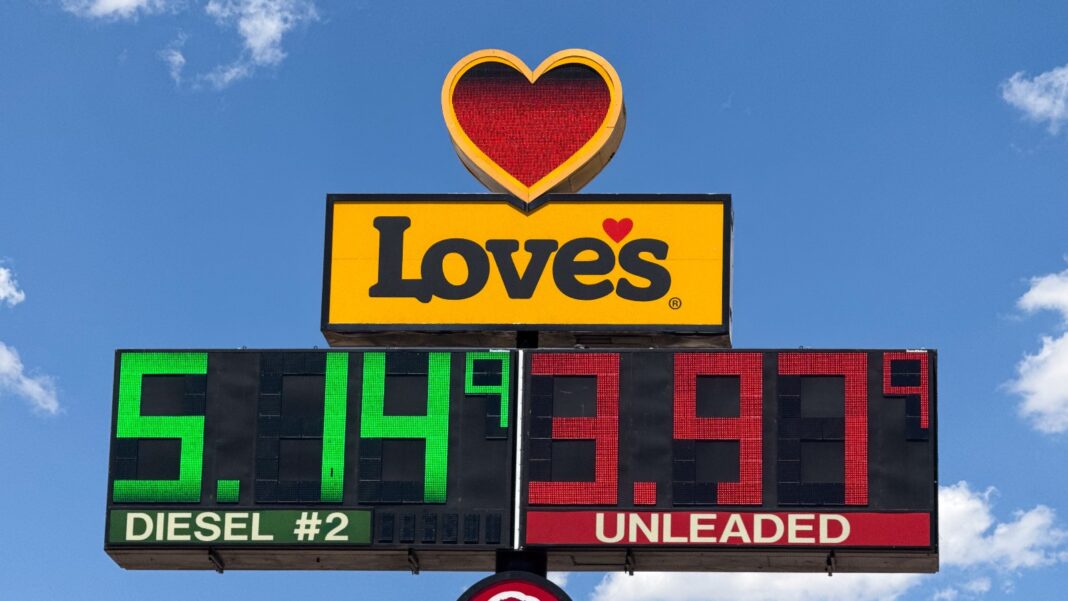
Featured photo: A Love's truck stop sign in Cheyenne, Wyoming, shows diesel at $5.149 a gallon on July 20, 2026. Representative image; prices shown are not the current national average. Photo: Tony Webster, via Wikimedia Commons (CC BY-SA 4.0). Cropped from the original.





.jpg)