



A salary figure is the most visible number in a job offer, and usually the easiest to compare. It is also an incomplete description of what a job is worth. The latest employer cost data from the Bureau of Labor Statistics show how much sits outside the paycheck, and why pay comparisons that stop at the salary line can mislead both employers and workers.
Our argument here is analytical, not a measured trend. No federal statistic tracks whether salary data are becoming more or less useful. The point is narrower: salary data answer only part of the question people use them for, and the rest needs to be labeled rather than guessed.
What the paycheck leaves out
According to the BLS Employer Costs for Employee Compensation release for June 2026, private-industry employers spent an average of $46.89 per hour worked on employee compensation. Wages and salaries accounted for $32.82, or 70.0%. Benefits accounted for $14.07, or 30.0%.
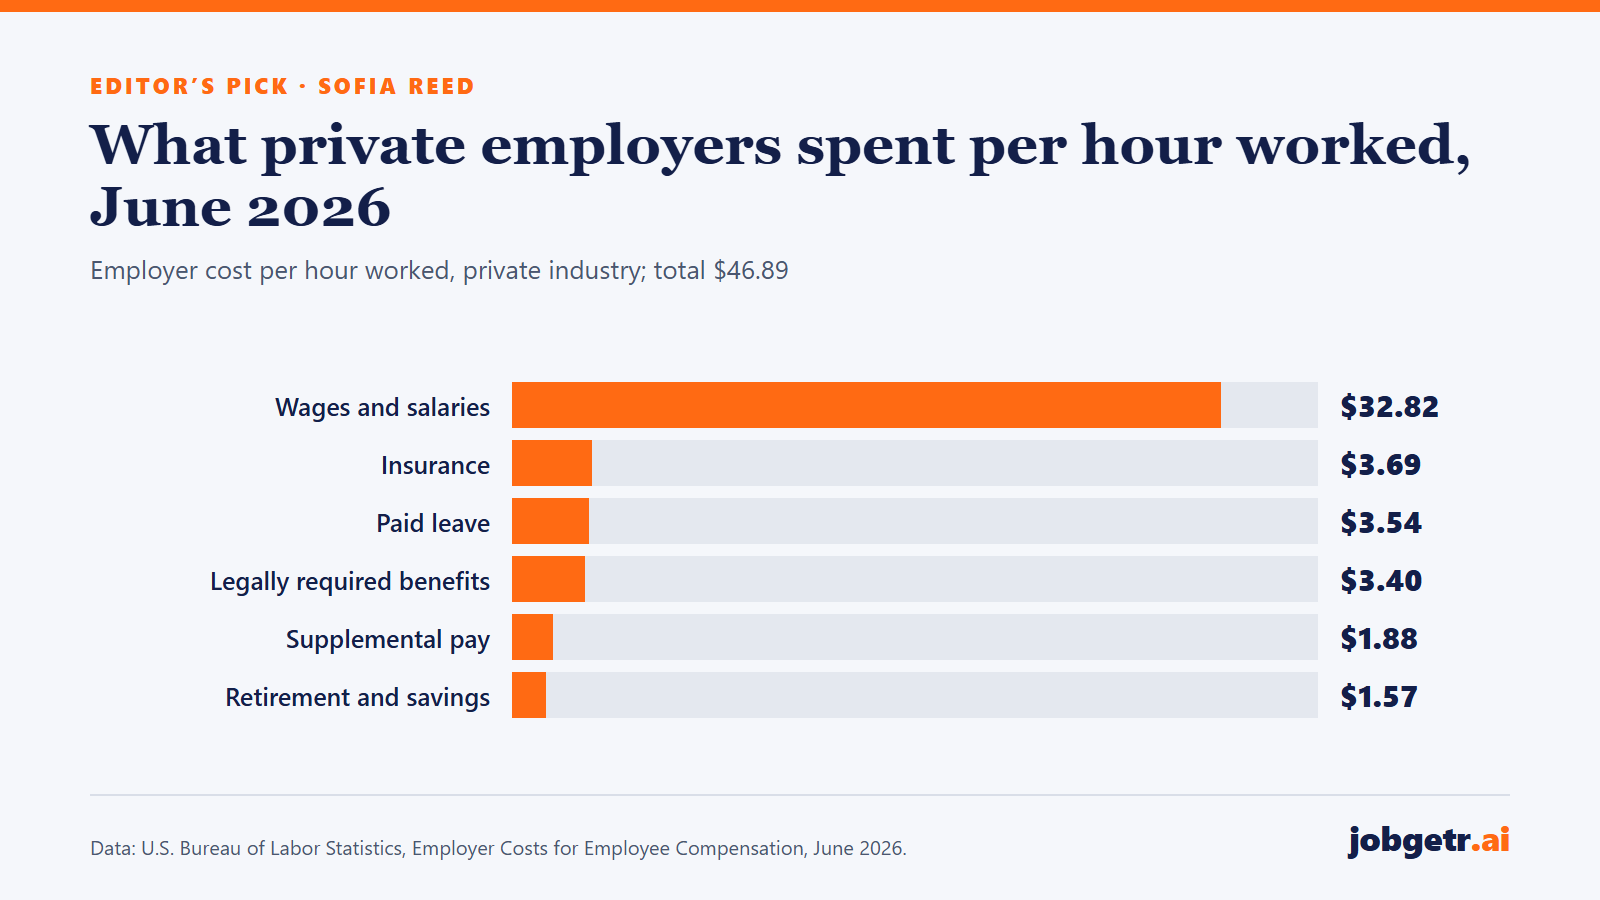
The benefit portion breaks down as follows in the detailed table for all private-industry workers:
- Insurance: $3.69 per hour (7.9% of total compensation)
- Paid leave: $3.54 (7.5%)
- Legally required benefits: $3.40 (7.2%)
- Supplemental pay: $1.88 (4.0%)
- Retirement and savings: $1.57 (3.3%)
Across all civilian workers, including state and local government, the average was $49.46 per hour, with $33.85 in wages and salaries and $15.61 in benefits. For state and local government workers alone, total costs averaged $66.45, and wages and salaries were 61.2% of the total.
The mix also differs by occupation. In private industry, wages and salaries were 68.5% of compensation costs for management, professional and related occupations, which averaged $78.88 per hour, and 76.9% for service occupations, which averaged $23.73. A salary comparison across those groups understates the difference in total compensation, because the higher-paid group also receives a larger share of its package as benefits.
What these figures are, and are not
These are employer costs, not worker take-home pay. They come from the National Compensation Survey, an establishment survey, and are expressed per hour worked. An employer’s cost for health insurance is not the same as the value a particular employee places on that coverage, and legally required benefits such as employer payroll taxes do not appear in anyone’s paycheck.
They are also averages across a very large and varied workforce. The $46.89 figure is not a market rate for any occupation, and it should not be used to price a single role. Nor should the ECEC wage figure be reconciled directly with the $37.75 average hourly earnings reported in the August employment report: the two come from different surveys with different definitions and reference periods.
What the data do establish is proportion. For the average private-sector hour worked in June, roughly 30 cents of every compensation dollar went to something other than wages and salaries. Two jobs with the same quoted salary can therefore represent quite different total packages and quite different costs to the employer.
Why job-quality data belong next to pay
Benefits are only one dimension a salary number omits. Others matter to workers at least as much, and several are not captured in national wage series at all:
- Pay structure. Base pay versus bonuses, commissions and other variable pay.
- Benefits. Health coverage, retirement contributions, paid leave.
- Hours and scheduling. Predictability of shifts, overtime, part-time versus full-time.
- Location requirements. On-site, hybrid or remote, and commuting cost.
- Stability and progression. Whether the role leads somewhere.
Some of these can be measured from postings or offers; others cannot be observed reliably. The right response to missing data is to mark it as missing. A single composite “job quality score” that blends observed pay with estimated, unobserved dimensions would look precise while hiding exactly the gaps a job seeker or employer needs to see.
Implications for employers and workers
For employers, the ECEC figures are a reminder that competing on salary alone ignores roughly three-tenths of the average compensation bill. An employer offering stronger benefits but a slightly lower salary may be more competitive than a salary benchmark suggests; one offering a higher salary with thin benefits may be less so. Communicating the full package, in comparable terms, is part of making an offer legible.
For workers, the practical step is to compare offers component by component rather than on the headline number: base pay, expected variable pay, what benefits cost the employee, paid leave, required hours and where the work happens. A higher salary can be the weaker offer once those are counted. The same logic applies when weighing a move from a current job: employer retirement contributions, paid leave and insurance already in place are part of what a switch would give up, and they belong in the comparison alongside the new salary.
For anyone building pay intelligence, including jobgetr.ai, the lesson is about labeling. Salary data are useful. They are most useful when they sit inside a transparent description of the job, with each dimension marked as observed, estimated or unavailable.
What to watch next
- The next ECEC release, covering September 2026, which will show whether the 70/30 split between wages and benefits in private industry is holding.
- Differences by occupation and industry, where the benefit share varies more than the national average suggests.
- Posted pay, which captures what employers advertise but often omits benefits and variable pay entirely.
Sources
- U.S. Bureau of Labor Statistics, “Employer Costs for Employee Compensation — June 2026,” September 9, 2026. https://www.bls.gov/news.release/ecec.nr0.htm
- U.S. Bureau of Labor Statistics, “Employer Costs for Employee Compensation, Table 4. Private industry workers by occupational and industry group, June 2026,” September 9, 2026. https://www.bls.gov/news.release/ecec.t04.htm
- U.S. Bureau of Labor Statistics, “The Employment Situation — August 2026,” September 4, 2026. https://www.bls.gov/news.release/empsit.nr0.htm
Featured photo: An employee stocks shelves at a farm retail store in Hudson, New York (2022). Representative image. Photo: USDAgov, via Wikimedia Commons (Public domain). Resized from the original.