


Labor Market
New applications for U.S. unemployment benefits edged down to 194,000 in the week ending Oct. 24, the Labor Department reported Thursday, Oct. 29. Seasonally adjusted initial claims fell 1,000 from the previous week, and the four-week moving average dropped to 196,750, its lowest level in the year of weekly figures published with the release.
The previous week was revised up by 1,000, from 194,000 to 195,000. That means the 194,000 reading first reported a week ago for the week ending Oct. 17 now stands at 195,000, and the new week’s figure is the lowest since the week ending July 18, when claims were 189,000, according to the department’s historical table.
The four-week average, which smooths out weekly noise, fell 1,250 from a revised 198,000. In the comparable week of 2025, initial claims were 221,000 and the four-week average was 226,750. Every week in the department’s table, which runs back to the week ending Oct. 18, 2025, shows a higher four-week average than the latest reading.
Fewer people collecting benefits
Continuing claims, a measure of laid-off workers still receiving state benefits, also declined. Seasonally adjusted insured unemployment was 1,701,000 in the week ending Oct. 17, down 21,000 from the prior week’s level, which was revised down by 6,000 to 1,722,000. The insured unemployment rate held at 1.1%, compared with 1.3% a year earlier, when 1,953,000 people were drawing benefits. The four-week average of insured unemployment rose slightly, by 500, to 1,710,000.
The two measures answer different questions. Initial claims track new separations, so a reading below 200,000 signals that employers are laying off relatively few workers. Continuing claims show how many people remain on benefits after losing a job. They can stay elevated when hiring is slow, because jobless workers take longer to land new positions. This week both measures moved down, though neither tracks hiring directly, and one week of data is not a trend.
Before seasonal adjustment
States reported 178,851 initial claims before seasonal adjustment in the week ending Oct. 24, an increase of 5,648, or 3.3%. The department’s seasonal factors had expected a slightly larger rise of 6,040, or 3.5%, which is why the adjusted figure slipped. Unadjusted claims were 203,012 in the comparable week of 2025.
Unadjusted insured unemployment rose 14,007, or 0.9%, to 1,490,071 in the week ending Oct. 17, well short of the 32,725 increase the seasonal factors anticipated. Across all programs, 1,500,078 continued weeks were claimed in the week ending Oct. 10, compared with 1,712,123 a year earlier. No state was triggered on to the Extended Benefits program.
Former federal civilian employees filed 442 initial claims in the week ending Oct. 17, down 113 from the prior week. In the comparable week a year earlier, federal workers filed 10,064 claims.
State detail
In the week ending Oct. 17, the latest week with state-level comments, Michigan posted the largest increase in initial claims, up 1,906, which the state attributed to layoffs in the manufacturing industry. Kentucky (+471) and South Carolina (+419) followed. Ohio reported the largest decrease, down 4,478, citing fewer layoffs in manufacturing, followed by Tennessee (-2,635), California (-1,930), New York (-1,554) and Pennsylvania (-1,532).
In Georgia, the advance count of initial claims was 3,569 in the week ending Oct. 24, down 78 from 3,647 the week before. Georgia’s insured unemployment, the number of people continuing to claim state benefits, was 21,245 in the week ending Oct. 17, down 1,149 from 22,394. For the week ending Oct. 17, Georgia’s initial claims were 578 below the comparable week a year earlier.
These state figures are not seasonally adjusted and cover Georgia statewide, not the Atlanta metro area. The department cautions that advance state claims are not directly comparable to earlier weeks, because they are counted by the state liable for paying benefits, while revised figures reflect where claimants live.
The weekly figures are advance estimates and are typically revised a week later. The insured unemployment rate is calculated against covered employment of about 153.9 million workers.
Sources
- U.S. Department of Labor, Employment and Training Administration, “Unemployment Insurance Weekly Claims” (USDL 26-1624-NAT), October 29, 2026. https://www.dol.gov/ui/data.pdf
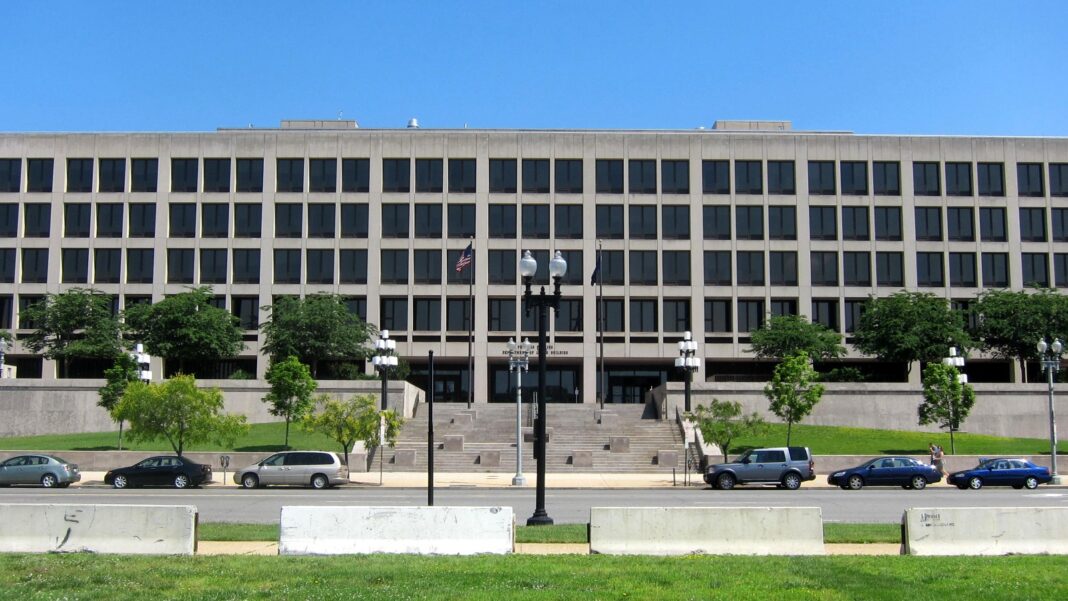
Featured photo: The Frances Perkins Building, headquarters of the U.S. Department of Labor, at 200 Constitution Avenue NW in Washington, D.C., May 30, 2010. Photo: AgnosticPreachersKid, via Wikimedia Commons (CC BY-SA 3.0). Cropped from the original.