


Artificial intelligence is now part of how many people search, write and code, and much of that use costs the user nothing. That raises a fair question for anyone who reads the quarterly GDP report: is the official measure of the economy keeping up? GDP was never designed to capture everything AI might be worth, and the research now available shows where the gap lies and how much depends on which concept of value is measured.
What GDP is built to measure
The U.S. Bureau of Economic Analysis defines GDP as the value of the final goods and services produced in the United States, without double counting the intermediate goods and services used up to produce them. It is a measure of market production, and that definition has direct consequences for services offered at a price of zero.
BEA states plainly how it treats free, advertising-supported services such as social media and email. It captures the output of these providers as intermediate consumption of the business that pays for the advertising. It does not attempt to value the consumer welfare gained from using the services, and so they are not included in household consumption in GDP. By similar logic, BEA leaves unpaid household work out of GDP because it is not traded in a market and there are no transactions to track.
This is a deliberate boundary, not an error. But when a technology delivers more to users without a matching rise in what they pay, GDP registers the spending and much less of the benefit.
Two ways researchers try to measure the gap
Two lines of research now put numbers on the problem. They measure different things.
The production approach. In a June 2026 BEA working paper, Leonard Nakamura of the Federal Reserve Bank of Philadelphia and BEA economists Jon Samuels and Rachel Soloveichik treat advertising- and marketing-supported content, including the free versions of AI chat tools, as a form of barter. The authors impute a value for that content based on its production cost, which keeps the estimate inside standard national-accounting concepts, and they exclude content already paid for or bundled into paid products to avoid double counting.
By their estimates, including free content raises average GDP quantity growth by 0.04 percentage point a year from 1929 to 1995, by 0.09 point from 1995 to 2022 and by 0.22 point from 2022 to 2025. They write that the trend break around 2022 was likely due to the development of AI.

These are research estimates, not official statistics. The Survey of Current Business summary carries a disclaimer that the views are the authors’ own. The paper calls its figures preliminary, notes that they rely on strong assumptions about prices, and says it is not a paper about the welfare effects of free content.
The welfare approach. A different tradition asks what people would need to be paid to give something up. In a 2019 paper in the Proceedings of the National Academy of Sciences, Erik Brynjolfsson, Avinash Collis and Felix Eggers used large online choice experiments to estimate the consumer surplus from digital goods. In their 2017 surveys, the median participant would have required about $17,530 to give up all search engines for a year, $8,414 for email and $3,648 for digital maps. The authors stress that GDP measures production and is not meant to measure well-being.
The Stanford Digital Economy Lab has applied this method to generative AI. In an April 2026 working paper, Brynjolfsson, Collis, Eggers, Sophia Kazinnik and David Nguyen report that the mean compensation U.S. adult users would require to give up AI chatbots for one month rose from $98 in July 2025 to $124.50 in March 2026. Combined with growth in adult users from 98 million to 115 million, they estimate that annual consumer surplus rose from about $116 billion to about $172 billion. They present this as an input to GDP-B, a benefits-based measure proposed as a complement to GDP, not a replacement for it.
Why the numbers cannot simply be added
The BEA estimate values free content at what it costs to produce. The Stanford estimate values it by what users say they would give up. The first stays within GDP’s production framework; the second measures welfare. Adding $172 billion of consumer surplus to GDP would mix concepts, and so would reading the 0.22-point adjustment as a measure of what AI is worth to people.
Each approach carries its own uncertainty. The Stanford authors acknowledge hypothetical bias in stated-preference surveys, the possibility that online respondents are more digitally engaged than the wider population, and a $500 cap on offers that 12% of respondents rejected. The BEA authors emphasize their strong assumptions about prices.
Conventional statistics still show something. BLS reported that nonfarm business labor productivity rose at a 1.4% annualized rate in the second quarter of 2026 and 2.2% over four quarters. Those figures cannot be assigned to AI; measured productivity reflects many forces at once. Neither alternative measure above is a test of AI’s effect on output per hour.
What this means for employers and workers
For employers, the lesson is not to infer AI’s value inside a firm from national GDP or productivity headlines, which are not built to detect a tool that saves time on a single task. Documented internal measures, such as time saved on specific processes, are more informative.
For workers, low or zero prices mean much of AI’s benefit may arrive as time and convenience rather than income, which wage data do not show. If AI changes the mix of jobs, employment and earnings statistics remain the place to look.
Three things are worth watching:
- Whether BEA moves any treatment of free content from research into the official accounts. The working paper argues its method needs no major conceptual changes to the 2025 System of National Accounts, but that is the authors’ argument, not a BEA decision.
- Further waves of the Stanford choice experiments.
- BLS productivity releases, read on their own terms.
The point is not that GDP is broken. GDP answers a specific question about market production, and AI raises questions it was never designed to answer alone.
Sources
- U.S. Bureau of Economic Analysis, “Gross Domestic Product (definition and latest release page),” accessed 2026-09-24. https://www.bea.gov/data/gdp/gross-domestic-product
- U.S. Bureau of Economic Analysis, “FAQ: How are free social media, email, and other ad-supported Internet services included in the BEA digital economy estimates?,” accessed 2026-09-24. https://www.bea.gov/help/faq/1250
- U.S. Bureau of Economic Analysis, “FAQ: Why isn’t household production included in GDP?,” accessed 2026-09-24. https://www.bea.gov/help/faq/1297
- U.S. Bureau of Economic Analysis, Survey of Current Business, “Research Spotlight: Estimating the Impact of “Free” AI Services on Growth and Productivity,” 2026-06-18. https://apps.bea.gov/scb/spotlights/2026/0626-free-data.htm
- U.S. Bureau of Economic Analysis (Nakamura, Samuels, Soloveichik), “The Progression of “Free” Digital Content to AI: Impacts on U.S. Economic Growth and Productivity, Working Paper WP2026-13,” 2026-06. https://www.bea.gov/sites/default/files/papers/BEA-WP2026-13.pdf
- Proceedings of the National Academy of Sciences (Brynjolfsson, Collis, Eggers), “Using massive online choice experiments to measure changes in well-being, vol. 116, no. 15, pp. 7250–7255,” 2019-04-09. https://www.pnas.org/doi/10.1073/pnas.1815663116
- Stanford Digital Economy Lab (Brynjolfsson, Collis, Eggers, Kazinnik, Nguyen), “What is Generative AI Worth? (working paper),” 2026-04-13. https://digitaleconomy.stanford.edu/publication/what-is-generative-ai-worth/
- U.S. Bureau of Labor Statistics, “Productivity and Costs, Second Quarter 2026, Revised,” 2026-09-03. https://www.bls.gov/news.release/prod2.nr0.htm
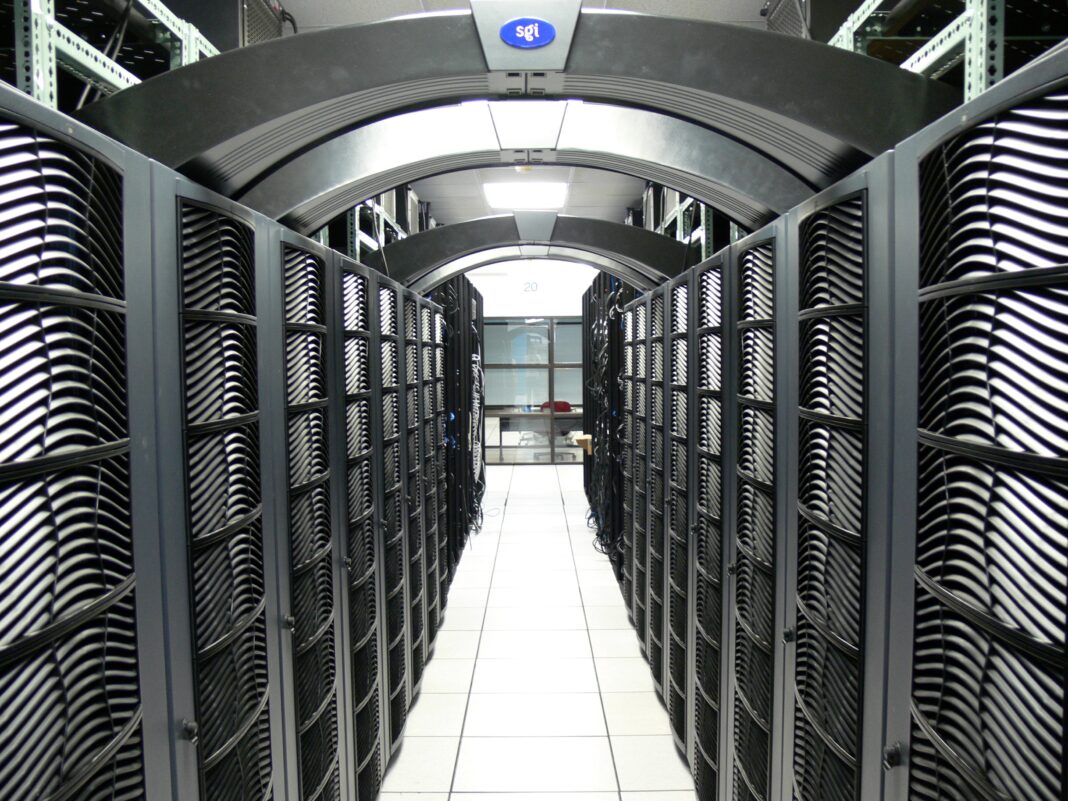
Featured photo: Server racks in the Virginia Tech data center. Representative image. Photo: Christopher Bowns, via Wikimedia Commons (CC BY-SA 2.0). Resized from the original.