


Questions about artificial intelligence and jobs now arrive faster than the statistics built to answer them. Employers want to know whether AI should change whom they hire. Workers want to know whether their field is shrinking. The standard monthly indicators remain indispensable, but none of them was designed to show which tasks inside a job have been automated or augmented. A useful labor-market dashboard for this period has to begin by being clear about which pieces already exist and which are still proposals.
What is available today
The core federal series answer the questions they were designed to answer, and they do it well. Each measures something specific.
- Payroll employment. The BLS establishment survey reported that nonfarm payrolls rose 162,000 in August 2026, while information employment fell 23,000. It counts jobs on employer payrolls; it does not say why they changed.
- Unemployment. The rate was 4.1% in August. It comes from a separate household survey and counts people, not jobs.
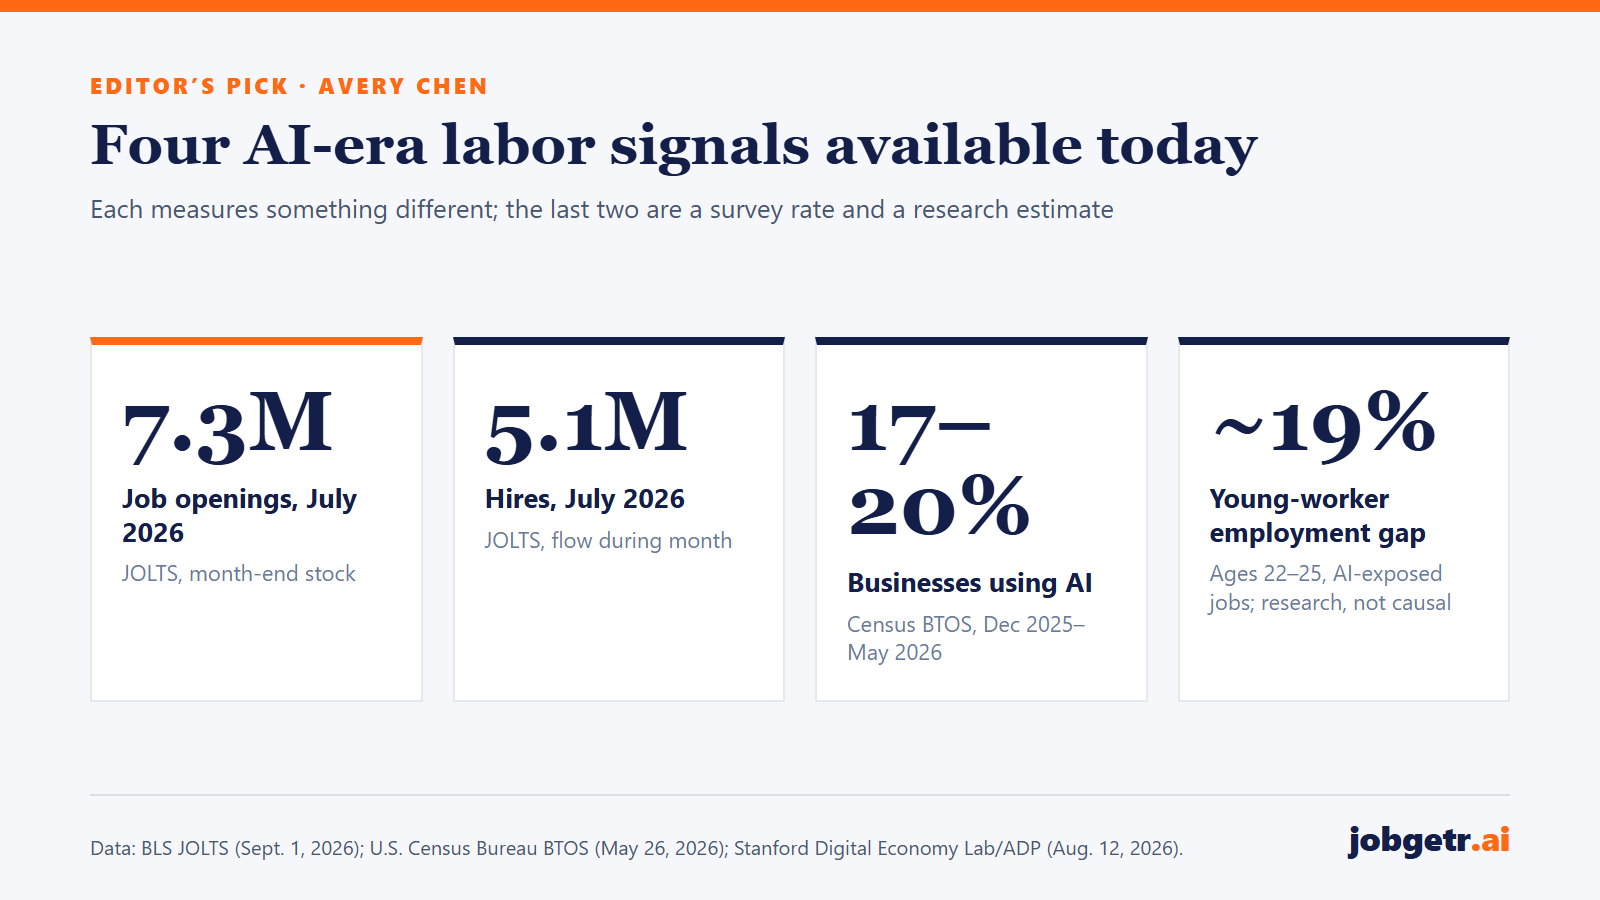
- Openings and hires. JOLTS recorded 7.3 million job openings on the last business day of July, a stock, and 5.1 million hires during the month, a flow.
- Pay. BLS average hourly earnings rose 3.1% over the year to August; after inflation, real average hourly earnings fell 0.3%. The Atlanta Fed Wage Growth Tracker, a median of nominal wage growth for individuals observed 12 months apart, was 4.1% in August. These are different measures of different groups and should not be expected to match.
- Productivity. Nonfarm business labor productivity rose at a 1.4% annualized rate in the second quarter, and labor’s share of output reached 52.8%, the lowest in a series that begins in 1947.
- Business AI use. The Census Bureau’s Business Trends and Outlook Survey found that between 17% and 20% of businesses used AI from December 2025 to May 2026, with larger firms more likely to report use. The question wording changed in November 2025, so comparisons across that change need care.
Alongside the official series, research datasets now offer AI-specific evidence. They are not official statistics, and their authors state their limits.
Using ADP payroll data, the Stanford Digital Economy Lab reported in August that employment of workers ages 22 to 25 in highly AI-exposed occupations is about 19% below where it would be had it kept pace with similarly aged workers in less-exposed occupations, up from 15% in July 2025. The adjustment appears to run mainly through reduced hiring of young workers rather than increased separations, and experienced workers show no comparable gap. The authors say they do not see widespread, economy-wide job displacement associated with AI, and they describe their findings as descriptive patterns, not causal estimates.
A September working paper by Bharat Chandar and Bouke Klein Teeselink analyzes 1.25 billion job postings and 154 million employment records across 41 countries, inferring company AI adoption from job advertisements that involve generative-AI use. Foreign affiliates of adopting companies reduced the junior share of their workforce relative to comparable control affiliates, mainly through growth in senior employment rather than a fall in junior employment. The employment records come largely from LinkedIn profiles, which the authors note over-represent managers and professionals.
What is still missing: proposed measures
The items below are proposals, not existing statistics. They describe what a dashboard would need to answer AI-specific questions directly.
- Task-level change. Current series count jobs and pay by occupation and industry. None directly records which tasks within a job have been automated or augmented. Occupational exposure scores estimate technical potential, not realized change.
- Adoption linked to outcomes. The Census survey tracks whether businesses use AI, and payroll surveys track employment. A regularly published statistic linking the two, by firm size and industry, would let readers see whether adopters hire differently.
- Hiring by career stage. The Stanford findings point to entry-level hiring as the place to watch. A regular public series of hires by age or career stage and occupation would allow such research to be checked against a common benchmark.
- Local AI evidence. Most AI evidence is national or international. For Atlanta, the baseline must be Atlanta data: BLS reported a 3.2% unemployment rate for the Atlanta-Sandy Springs-Roswell metro in July 2026 (not seasonally adjusted, preliminary), with payroll employment down 0.1% from a year earlier. No Atlanta-specific AI adoption series is used here, and Georgia or national figures should not stand in for one.
Design rules come before new metrics
A dashboard’s first responsibility is to prevent misleading comparisons. A few rules matter more than any new indicator:
- Label every figure with its source, survey, reference period and geography.
- Keep stocks and flows apart. Openings are not hires, and job postings are not openings.
- Separate official statistics from research estimates, and put research caveats beside the chart, not in a footnote.
- Never present an exposure score as a layoff forecast, or a national wage series as a local reading.
What it means for employers and workers
For employers, existing data already support better decisions than anecdote: flat payrolls in a sector, slower hires or a thinning entry-level pipeline are all observable. What the data cannot yet do is tell a firm how AI will change a particular role. That still requires internal measurement of tasks and outcomes.
For workers, the most relevant research finding so far concerns entry: the evidence points to fewer hires of young workers in exposed occupations rather than broad job losses. That is a signal to track in hiring data, not a settled conclusion.
What to watch next: further Census survey releases on business AI use, updates to the Stanford payroll research, and whether statistical agencies add task-level questions to existing surveys. Until then, the most useful dashboard is one that shows where its measurements stop.
Sources
- U.S. Bureau of Labor Statistics, “The Employment Situation — August 2026,” 2026-09-04. https://www.bls.gov/news.release/empsit.nr0.htm
- U.S. Bureau of Labor Statistics, “Job Openings and Labor Turnover Summary — July 2026,” 2026-09-01. https://www.bls.gov/news.release/jolts.nr0.htm
- U.S. Bureau of Labor Statistics, “Real Earnings — August 2026,” 2026-09-11. https://www.bls.gov/news.release/realer.nr0.htm
- Federal Reserve Bank of Atlanta, “Wage Growth Tracker (August 2026 update),” 2026-09. https://www.atlantafed.org/research-and-data/data/wage-growth-tracker
- U.S. Bureau of Labor Statistics, “Productivity and Costs, Second Quarter 2026, Revised,” 2026-09-03. https://www.bls.gov/news.release/prod2.nr0.htm
- U.S. Census Bureau (Grundy, Breaux, Khatiwoda), “Large Firms With at Least 20 Employees Biggest AI Users (Business Trends and Outlook Survey),” 2026-05-26. https://www.census.gov/library/stories/2026/05/ai-use-businesses.html
- Stanford Digital Economy Lab, “No Widespread Displacement, but the AI Employment Gap for Young Workers Has Widened to 19%,” 2026-08-12. https://digitaleconomy.stanford.edu/news/canariesaug26/
- Stanford Digital Economy Lab (Chandar, Klein Teeselink), “How Does AI Change Labor Demand? Evidence from 41 Countries (publication page),” 2026-09-21. https://digitaleconomy.stanford.edu/publication/how-does-ai-change-labor-demand/
- Stanford Digital Economy Lab (Chandar, Klein Teeselink), “How Does AI Change Labor Demand? Evidence from 41 Countries (working paper PDF),” 2026-09-20. https://digitaleconomy.stanford.edu/app/uploads/2026/09/HowDoesAIChangeLaborDemand.pdf
- U.S. Bureau of Labor Statistics, “Metropolitan Area Employment and Unemployment — July 2026 (with tables 1 and 3),” 2026-09-02. https://www.bls.gov/news.release/metro.nr0.htm
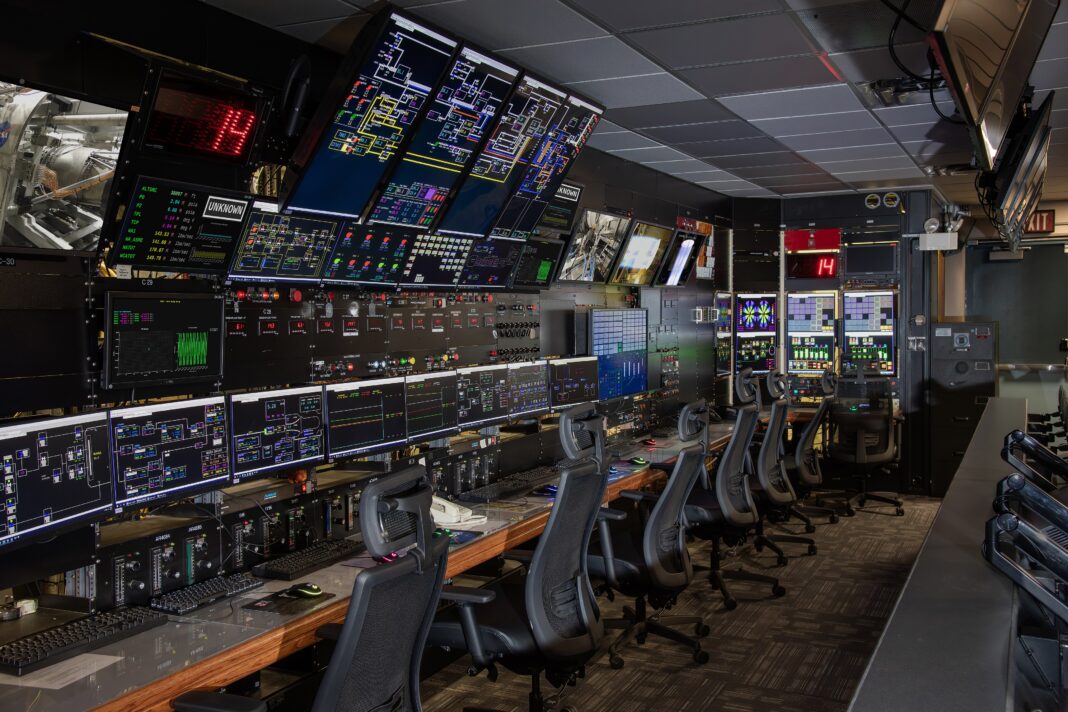
Featured photo: An engineer monitors a data system at NASA Glenn Research Center's Propulsion Systems Lab. Representative image of data dashboards. Photo: NASA Glenn Research Center / Quentin Schwinn, via Wikimedia Commons (Public domain). Resized from the original.



_recently_remodeled_control_room_(GRC-2025-C-07466).jpg)