


A large labor pool does not guarantee that every worker can reach every job. That idea sits behind a common hypothesis about metro Atlanta: that the region’s next workforce constraint may be transportation rather than talent. Public data cannot yet test that hypothesis directly. They cannot rank commuting against skills, pay or housing as a barrier to hiring. What they can show, in detail, is how metro Atlanta’s workers get to work, how long it takes and who carries the heaviest commuting burden.
The answer from the Census Bureau’s American Community Survey is clear on one point. The longest trips fall on the small group of workers who ride public transportation, and those workers earn considerably less than the typical commuter.
How metro Atlanta gets to work
The 2024 American Community Survey one-year estimates, the most recent available on the Census Bureau’s data platform when checked, count about 3.26 million workers age 16 and older living in the Atlanta-Sandy Springs-Roswell metro area. Of those, 67.8% drove alone, 8.5% carpooled, 1.6% took public transportation, 1.1% walked and 18.8% worked from home. Nationally, 3.7% of workers used transit and 13.3% worked from home.
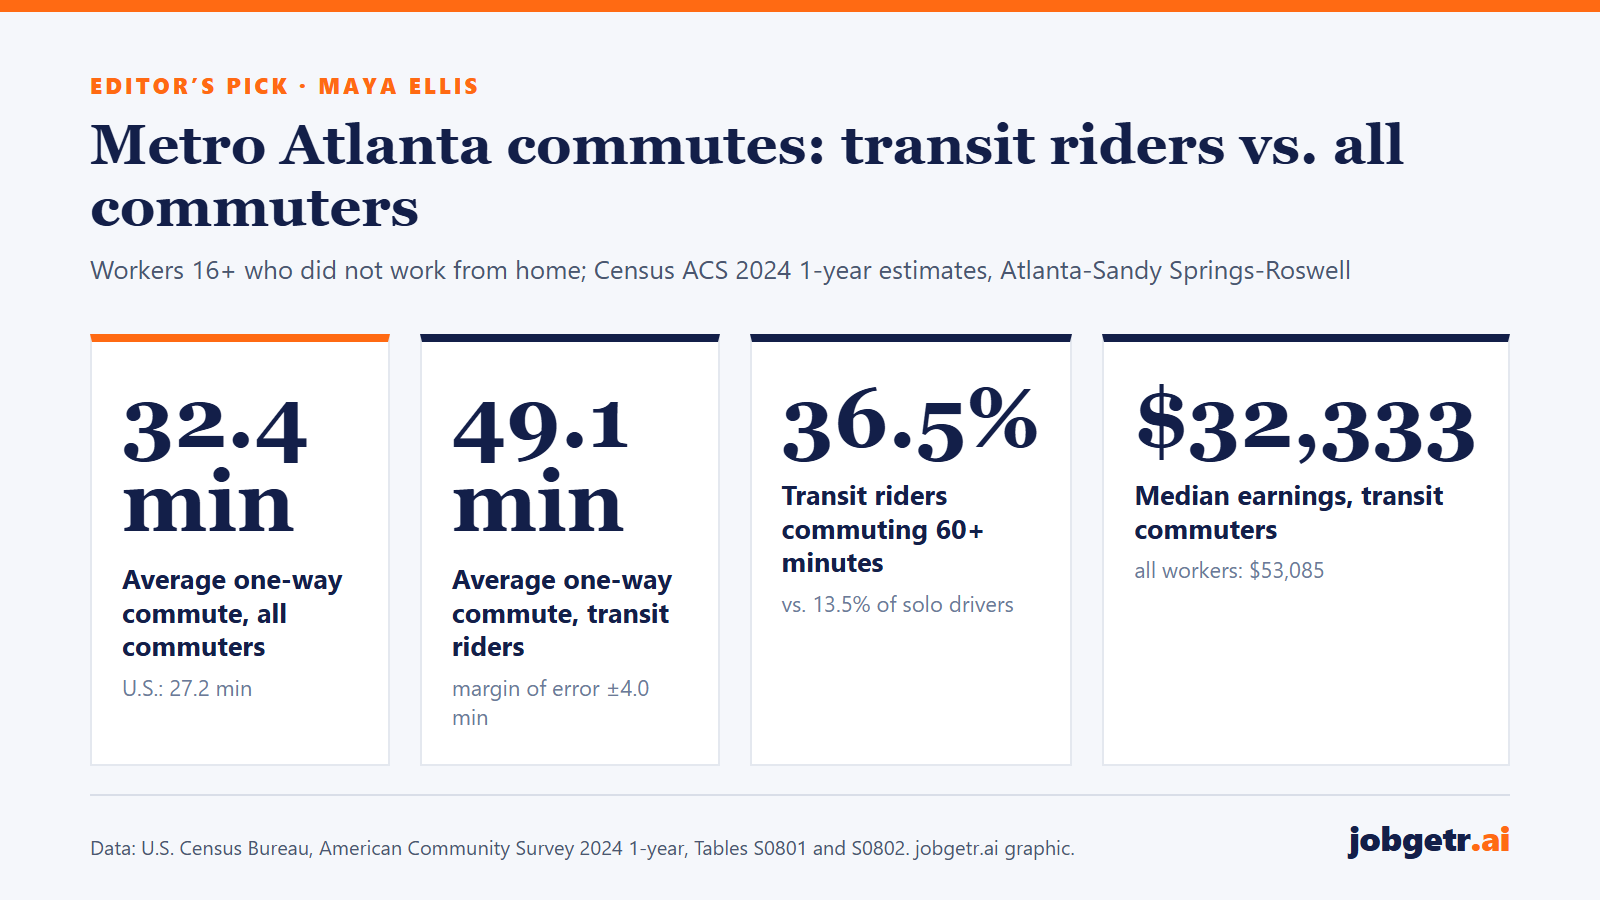
Among workers who did not work from home, the average one-way trip took 32.4 minutes, compared with 27.2 minutes nationally. About 13.8% of metro Atlanta commuters traveled an hour or more each way, compared with 9.3% nationwide. Commutes also cross jurisdictional lines: 40.1% of the metro’s workers worked outside their county of residence, compared with 22.3% of workers nationally.
Most workers have access to a car. Only 2.9% of metro Atlanta workers lived in households with no vehicle available, below the national figure of 4.7%.
The burden falls unevenly
The survey estimates about 52,300 metro Atlanta workers commuted by public transportation, with a margin of error of roughly 6,200. For that group:
- The average commute was 49.1 minutes each way (margin of error 4.0 minutes), compared with 32.4 minutes for people who drove alone.
- An estimated 36.5% traveled an hour or more each way (margin 5.1 points), compared with 13.5% of solo drivers.
- Median earnings were $32,333, compared with $51,918 for solo drivers, $36,256 for carpoolers and $80,627 for people who worked from home. The median for all workers was $53,085.
- About 27.1% lived in households with no vehicle available, compared with 1.6% of solo drivers.
These figures describe a group that is small as a share of the workforce but distinct: lower-earning, more likely to lack a car, and spending substantially more time getting to work. The survey does not tell us why. Workers may choose transit for many reasons, and the earnings gap is a correlation, not evidence that transit use lowers pay.
Work schedules add another layer. About 5.0% of metro Atlanta commuters left for work between midnight and 4:59 a.m., and 26.0% left at 9 a.m. or later. The survey does not show how those departure times line up with transit service.
What has changed since 2019
Comparing with the 2019 survey, when the metro was published under the name Atlanta-Sandy Springs-Alpharetta, the biggest shift was working from home, which rose from 8.8% of workers to 18.8%. Driving alone fell from 76.3% to 67.8%, and the transit share fell from 2.8% to 1.6%. The average commute for those who still traveled was essentially unchanged, at 32.5 minutes in 2019 and 32.4 minutes in 2024, and the share with hour-plus trips edged down from 14.2% to 13.8%. Metro definitions are periodically updated, so small differences should be read cautiously.
The work-from-home shift matters for this debate. Remote work is concentrated among higher earners, whose median earnings in 2024 were more than twice those of transit commuters. For many jobs that must be done in person, in health care, logistics, retail and hospitality, the commute has not disappeared.
What the data do not show
The survey counts people who have jobs and describes how they reach them. It does not count people who turned down or never applied for jobs because the trip was too long, and it does not measure transit routes, service frequency or how many jobs are reachable from a given neighborhood. It therefore cannot establish that transportation is a bigger constraint on Atlanta hiring than skills, wages or housing costs. The metro’s unemployment rate of 3.2% in July 2026 (preliminary, not seasonally adjusted, according to the Bureau of Labor Statistics) also says nothing about commuting.
Answering the original question would require joining employer locations and shift times with published transit schedules, regional travel-survey data and evidence from workforce programs on why candidates decline or leave jobs. We have not yet verified such data for this piece.
Implications for employers and workers
For employers filling in-person, lower-wage roles, the commuting data suggest that location and scheduling can shape who is able to take a job. Where a meaningful share of candidates rely on transit, an hour-plus commute is common rather than exceptional, and early-morning start times may be harder to reach.
For workers, especially those without a car, commute time is part of the real cost of a job offer and is worth weighing alongside pay.
For planners and policymakers, the numbers point to a specific, measurable group of workers for whom access is a daily issue. The next step is to test whether that access problem constrains hiring, rather than assume it does. We will revisit the question when 2025 survey estimates are released and when route-level accessibility data can be verified.
Sources
- U.S. Census Bureau, “American Community Survey 2024 1-year estimates, Table S0801: Commuting Characteristics by Sex, Atlanta-Sandy Springs-Roswell, GA Metro Area,” 2025 (2024 ACS 1-year release). https://data.census.gov/table/ACSST1Y2024.S0801?g=310XX00US12060
- U.S. Census Bureau, “American Community Survey 2024 1-year estimates, Table S0801: Commuting Characteristics by Sex, United States,” 2025 (2024 ACS 1-year release). https://data.census.gov/table/ACSST1Y2024.S0801?g=010XX00US
- U.S. Census Bureau, “American Community Survey 2024 1-year estimates, Table S0802: Means of Transportation to Work by Selected Characteristics, Atlanta-Sandy Springs-Roswell, GA Metro Area,” 2025 (2024 ACS 1-year release). https://data.census.gov/table/ACSST1Y2024.S0802?g=310XX00US12060
- U.S. Census Bureau, “American Community Survey 2019 1-year estimates, Table S0801: Commuting Characteristics by Sex, Atlanta-Sandy Springs-Alpharetta, GA Metro Area,” 2020 (2019 ACS 1-year release). https://data.census.gov/table/ACSST1Y2019.S0801?g=310XX00US12060
- U.S. Bureau of Labor Statistics, “Metropolitan Area Employment and Unemployment — July 2026,” 2026-09-02. https://www.bls.gov/news.release/metro.nr0.htm
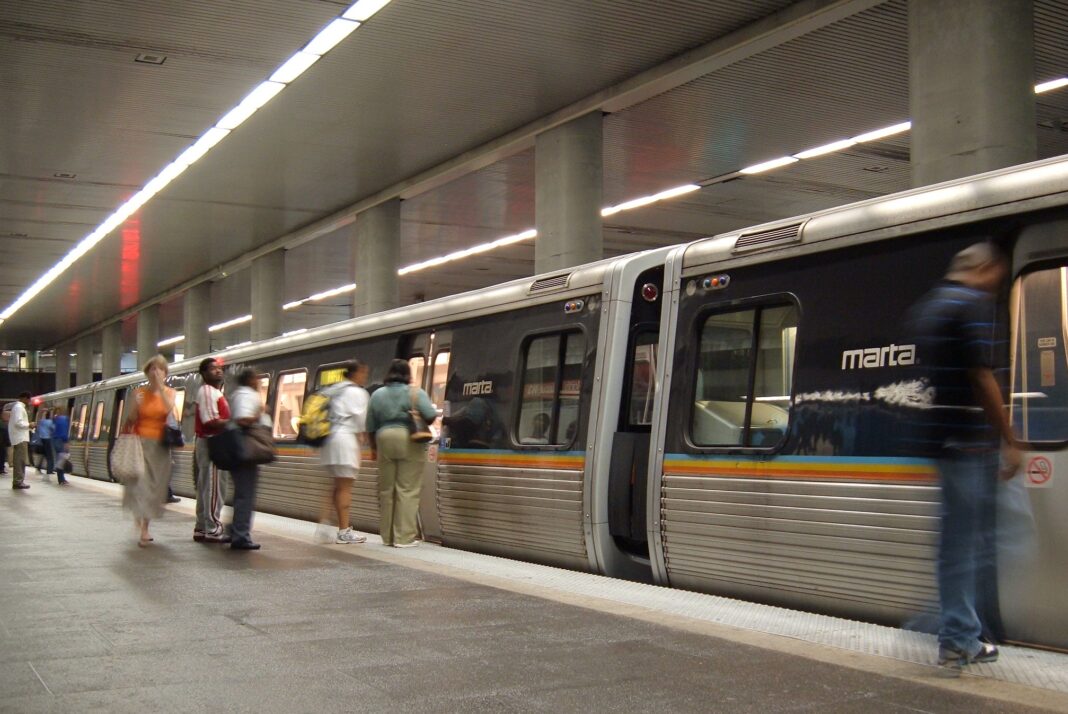
Featured photo: A MARTA train at North Avenue station in Atlanta. Photo: Scott Ehardt, via Wikimedia Commons (Public domain).